
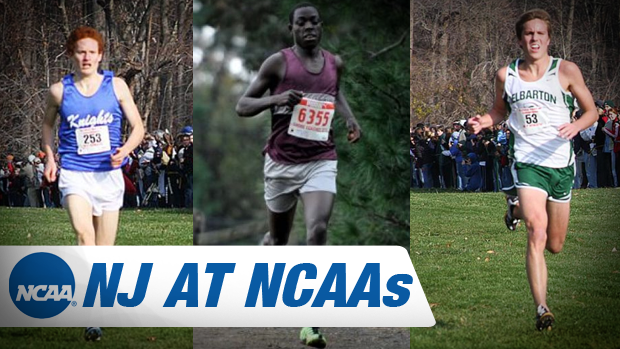
(Left to right) Jim Rosa, Edward Cheserek, and Morgan Pearson shown competing back in HS, they had a great run on Saturday for their current college teams. / Photos / Pat Montferrat and MaroonNews
BOYS
New Jersey's past high school stars win the home state battle at NCAAs! With three finishers in the top 15 point cards thanks to Oregon's Edward Cheserek (St. Benedict's), Standford's Jim Rosa (West Windsor-Plainsboro North), and Colorado's Morgan Pearson (Delbarton School). All of these men have been posting great seasons, although Edward Cheserek may have stole the show winning the NCAA Champs as a freshman at Oregon! His time was 29:41 and a huge push towards the end secured his victory over the defending champion! Jim Rosa had an incredible run and seeing how pumped he is at the end of the race embedded below is just fantastic, finished 5th with a time of 30:08! To continue the top five for NJ we look to Tyler Udland who graduated in 2010 from Millburn and now runs for the Princeton Tigers, he placed 47th overall with a time of 30:53 in the 10k. The 5th man for NJ was Robert Molke of Syracuse University who graduated from Don Bosco Prep in 2009. He ran a 30:55 to place 51st overall.
Watch more video of NCAA Division 1 Cross Country Championships 2013 on flotrack.org
Actual Top 20 from NCAA
| Place | Athlete | Team | Result | Points | ||
|---|---|---|---|---|---|---|
| 1 | Cheserek, Edward | University of Oregon | 29:41.10 | 1 | ||
| 2 | Kithuka, Kennedy | Texas Tech University | 29:59.10 | -- | ||
| 3 | Korolev, Maksim | Harvard University | 29:59.50 | 2 | ||
| 4 | Zienasellassie, Futsum | Northern Arizona University | 30:05.70 | 3 | ||
| 5 | Rosa, James | Stanford University | 30:08.90 | 4 | ||
| 6 | Kebenei, Stanley | University of Arkansas | 30:10.10 | 5 | ||
| 7 | Colley, Andrew | NC State University | 30:12.50 | 6 | ||
| 8 | Saarel, Ben | University of Colorado | 30:14.10 | 7 | ||
| 9 | Tiernan, Patrick | Villanova University | 30:15.70 | 8 | ||
| 10 | Caldwell, Luke | University of New Mexico | 30:17.20 | 9 | ||
| 11 | Dohner, Ryan | University of Texas | 30:18.10 | 10 | ||
| 12 | Lusignan, Trent | South Dakota State University | 30:18.80 | -- | ||
| 13 | Fauble, Scott | University of Portland | 30:21.30 | 11 | ||
| 14 | Geoghegan, Will | Dartmouth College | 30:22.10 | 12 | ||
| 15 | Lutz, Craig | University of Texas | 30:22.90 | 13 | ||
| 16 | Farrell, Thomas | Oklahoma State University | 30:23.50 | 14 | ||
| 17 | Pearson, Morgan | University of Colorado | 30:25.00 | 15 | ||
| 18 | King, Kyle | University of Virginia | 30:27.30 | 16 | ||
| 19 | Rotich, Anthony | UTEP | 30:27.30 | -- | ||
| 20 | Nelson, Aaron | University of Washington | 30:27.40 | -- | ||
| Place | Team | Points | Scorers | Times | ||
|---|---|---|---|---|---|---|
| 1 | University of Colorado | 149 | 7+15+19+30+78 (89+145) | 1:03 1-5 Split | 30:39 Avg | ||
| 2 | Northern Arizona University | 169 | 3+20+23+61+62 (113+165) | 0:58 1-5 Split | 30:41 Avg | ||
| 3 | Oklahoma State University | 230 | 14+25+51+66+74 (115+176) | 0:51 1-5 Split | 30:53 Avg | ||
| 4 | Brigham Young University | 267 | 17+28+55+70+97 (98+112) | 0:57 1-5 Split | 30:59 Avg | ||
| 5 | University of Oregon | 274 | 1+43+47+63+120 (201+209) | 2:05 1-5 Split | 30:53 Avg | ||
GIRLS
The girls side was impressive as well, finishing 8th in the home state comparison. They were led by Marielle Hall who currently runs for the University of Texas and graduated from Haddonfield Memorial in 2010, she placed 29th overall with a time of 20:40 in the 6k. Right behind her was Dana Giordano who now runs for Dartmouth College and graduated from Bernards in 2012, she ran 20:41 and finished 31st. Megan Curham who just graduated last year from Villa Walsh finished 34th for the Princeton Tigers running 20:42 as a freshman! Sara Disanza another freshman for the University of Wisconsin who graduated 2013 from High Point Regional took 104th with a time of 21:20! Rounding out the top five for those who call NJ a home state was Megan Lacy who graduated 2012 from Cherokee HS and now runs for Stanford University. She finished 143rd with a time of 21:36.
| F 6,000 Meter Run - Finals | ||||||
|---|---|---|---|---|---|---|
| Place | Athlete | Team | Result | Points | ||
| 1 | D'Agostino, Abbey | Dartmouth College | 20:00.30 | 1 | ||
| 2 | Bates, Emma | Boise State University | 20:03.90 | -- | ||
| 3 | Avery, Kate | Iona College | 20:05.40 | -- | ||
| 4 | Cuffe, Aisling | Stanford University | 20:09.30 | 2 | ||
| 5 | Lipari, Emily | Villanova University | 20:10.80 | 3 | ||
| 6 | Quigley, Colleen | Florida State University | 20:11.30 | 4 | ||
| 7 | Sisson, Emily | Providence College | 20:17.50 | 5 | ||
| 8 | Houlihan, Shelby | Arizona State University | 20:20.90 | -- | ||
| 9 | Kipp, Shalaya | University of Colorado | 20:21.70 | 6 | ||
| 10 | Santisteban, Kelsey | University of California | 20:21.70 | -- | ||
| Team Scores | ||||||
|---|---|---|---|---|---|---|
| Place | Team | Points | Scorers | Times | ||
| 1 | Providence College | 141 | 5+16+24+42+54 (186) | 0:50 1-5 Split | 20:45 Avg | ||
| 2 | University of Arizona | 197 | 10+13+26+64+84 (131+210) | 0:56 1-5 Split | 20:53 Avg | ||
| 3 | Butler University | 200 | 15+25+45+52+63 (159+200) | 0:37 1-5 Split | 20:58 Avg | ||
| 4 | University of Michigan | 215 | 18+37+38+44+78 (127+175) | 0:40 1-5 Split | 20:59 Avg | ||